
2023 SOA Challenge: Relocation Social Insurance Case Study
The University of New South Wales
Group 3
Team Members: Lai Wei, Dion Zhuo, Osmaan Rasouli, Hiba Fatima, Felix Tran
ACTL5001 Group3 Project - Relocation Social Insurance
1.Executive Summary
Storslysia has contacted Group 3 Consulting to design a social insurance program to combat the increasing economic costs of relocation due to displacement rising from catastrophic climate related events. The program outlined in this report provides both incentive-based voluntary relocation as well as involuntary displacement and damage cover. The incentives program will run for 10 years and provide Ꝕ2000 for relocation to low-risk regions. This incentive serves as a low-cost program aimed at reducing the overall costs incurred from natural disasters in the country due to involuntary displacement, goods replacement, material and labour costs. Under this program design, it is expected that Storslysia will have reduced overall costs from natural disasters in all forecasted emission scenarios.
2.Objectives
The proposed Relocation Social Insurance (RSI) program will address displacement issues resulting from hazard events which is particularly crucial due to a growing concern regarding global warming and climate change. The RSI program has both a proactive and reactive approach to manage displacement costs within the country. The program offers a voluntary relocation incentive payment to those who currently live in a high-risk region when they relocate to a low-risk region before a hazardous event occurs. Involuntary displacement cover is offered to relocate people who live in a property which has been significantly damaged from a hazardous event. Historic property damage costs are large and have been analysed in detail to understand potential future displacement costs which is demonstrated in Appendix A.1. With this voluntary movement, the program aims to reduce Storslysia’s catastrophe-related displacement costs under all forecasted scenarios. The RSI program is offered to the entire population of Storslysia and is designed with consideration to key demographic information. Furthermore, expected future program costs have been estimated to ensure that total costs remain below 10% of GDP. This is a key consideration which will enable the program to remain sustainable in the long run. A conservative approach has been utilised in which a high emissions scenario has high levels of inflation and a generous margin have been allocated to confidently assure that costs will not exceed this threshold.
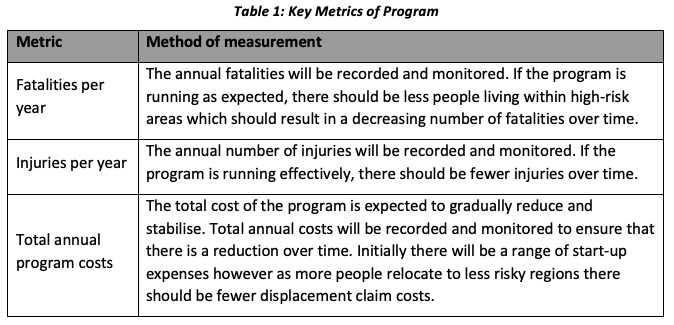
2.1 Key Metrics
3.Program Design
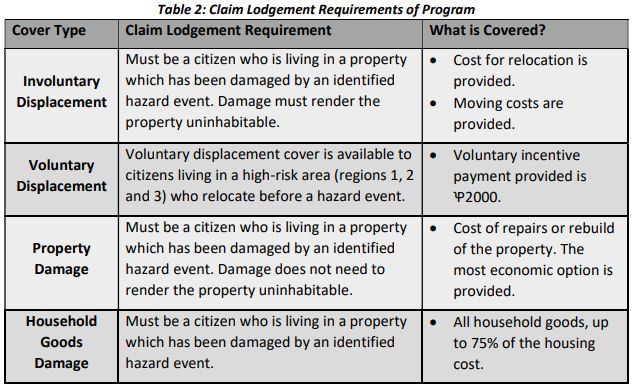
3.1 Claim Lodgement Requirements
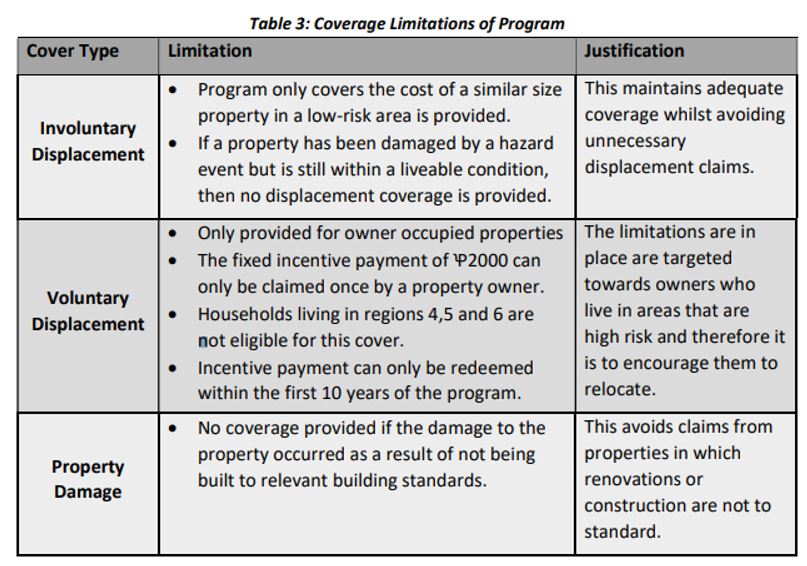
3.2 Coverage Limitations
3.3 Policy Incentives
The program has a few key incentives embedded in its design to reduce the overall economic costs of displacement within the country. The key incentives are outlined below:
- Bonus relocation incentive payment A bonus relocation payment of Ꝕ2000 will be provided to those living in owner occupied properties who voluntarily relocate from a high-risk area to a low-risk area prior to a hazard event.
- Community disaster awareness program A community disaster awareness program is set up to creative awareness of the program as well as inform the community of the risks of continuing to live within regions that are deemed to be high-risk. The program will be organised by the taskforce and a variety of awareness tools will be utilised. A key tool will be holding sessions and talks at local community centres in which our environmental experts will provide key insights into the increasing number of environmental disasters and the impact of climate change.
3.4 Quantitative and Qualitative Justifications of the Program
3.4.1 Quantitative Justifications
A key quantitative objective is to reduce the overall economic impact of hazards to residential properties by controlling property damage costs. Economic cost projections over both the short- and long-term horizons demonstrate that the program has reduced total impacts of hazard events. In the conservative high emissions projection model, there is 0.3% reduction in short-term costs and a 4.9% reduction in long-term costs. In the less conservative scenario of low emissions, there are reductions of 0.3% in the short term and 9.2% in the long term. Despite short-term reductions appearing minimal in percentage terms, these in magnitude are considered substantial. In addition to this, various scenario and stress testing also demonstrate that costs will remain below the 10% GDP threshold which enables ongoing sustainability of the program.
3.4.2 Qualitative Justifications
The proposed program is designed to achieve the two key qualitative objectives; lower hazard mortality and lower hazard-related injuries. Through voluntary relocation, there are fewer residents of high-risk regions that will endure severe hazard events. These severe events cause higher levels of mortality and injuries. Indirectly by maintaining the health and well-being of citizens during hazard events, the program will have positive economic impacts. These include fewer people taking time off work due to injuries preventing them from being able to perform their work duties and fewer people who have been injured excessively and therefore not being able to return to work.
3.4 Short-Term and Long-Term Objectives
The program will be monitored annually to ensure that the outlined objectives are achieved. Total costs have been evaluated over the short term (first 10 years) and the long term (100-year timeframe) which are displayed in Appendix B.1 and Appendix B.2 respectively. In both timeframes expected total costs are below GDP and the program has resulted in a reduction in total property damage.
4.Pricing/Costs
4.1 Economic Costs Projections Methodology
Data cleaning has been conducted as an initial step before the modelling process. This involved truncating the data after 1960, removing two outlier hazard events and on-levelling property damage. Hazard events have also been regrouped into 7 categories based on their nature.
- Model historical claims type Fatalities and injuries are converted into monetary values of Ꝕ4 760 884 and Ꝕ203 910 respectively (Department of the Prime Minister and Cabinet, 2022). These are then used to calculate the total cost of a natural disaster by summing them with the inflation-adjusted property damages. Afterwards, an unsupervised K-means clustering is applied on the total costs to classify the historical natural disaster events into minor, medium and major severities.
- Model claims count From the K-mean’s result, there are 6 major claims, 115 medium claims and 2934 minor claims, where the major type gives the highest average total cost, defined as total cost (as outlined previously) divided by the number of claims. The number of claims for each region is then modelled using a frequency projection model. The expected number of hazard events in 2020 is just a simple average of the K-mean’s result. The total expected number of hazard events is subsequently allocated to each region’s frequency model by claims type.
- Model severity costs From the correlation matrix in Appendix C.1, there is no strong correlated variables among fatalities, injuries, and on-levelled property damage. Thus, to model severity, total cost is used and is seen as “total_cost” in its empirical distribution in Appendix C.8. Based on the distribution, a GLM (family = Gamma) with log link is used to model the amounts, with a lasso penalty applied when estimating the model. The variables used in the model are region, quarter, hazard group and hazard type. Based on the GLM estimates in Appendix C.2, region 2 has the largest impact within all regions, while hazard group 5 (Hurricane/Tropical Storm) has the largest impact within all hazard groups, and the total damage occurred in quarter 4 is the most severe.
- Model future inflation For the inflation, as it is a time series data, an ARIMA method was selected to do the projection. From the analysis shown in Appendix C.3, the sample PACF drops suddenly inside the confidence interval after lag 1. This suggests the data can be fit with an AR(1). The short-term inflation is selected by the 10-year average of the AR(1) projection. The AR(1) gives an estimation of 3.595% for long term inflation. The final long-term inflation is selected at 6.595% to allow for the future uncertainty.
4.2 Projection Results
4.2.1 Economic costs without the program
To project the economic costs that would be incurred without the program, the following components have been considered:
- The claims costs including injuries, fatalities and property damage caused by future hazard events are projected using GLM.
- A 75% margin on top of the claim costs is added for replacing household goods.
- Due to possible demand change, the price for material and labour will increase, and thus a 50% margin is added on top of the claim costs.
- Involuntary movement costs to temporary housing, caused by destruction of houses.
4.2.2 Economic costs with the program
To project the economic costs with the program in place, the following additional items have been taken into consideration:
- The incentive program encouraging people to relocate from high-risk areas to a low-risk areas will incur an incentive cost.
- Benefits from voluntary relocation scheme as there is a reduction in exposure will lead to a cost reduction.
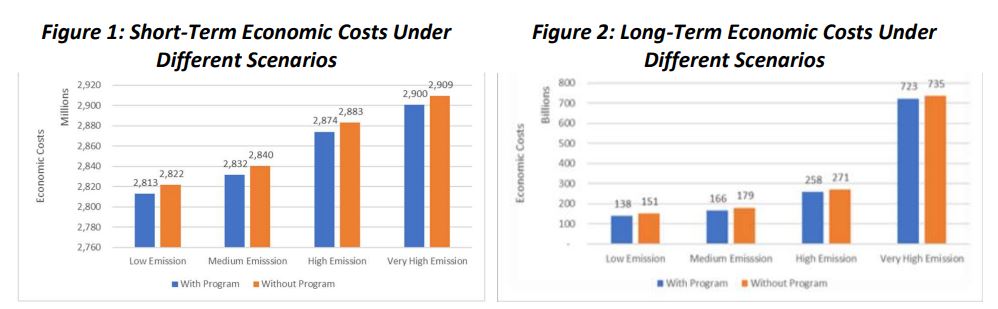
- For the short-term economic costs, a 10-year time frame is used, which was calculated as a simple average of 2020 economic costs and the projected 2030 economic costs (Appendix C.4 and Appendix C.5). From the short-term graph on the left above, with program will incur relatively smaller costs compared to the long term for any future scenarios. From the long-term graph on the right above, the very high emission gives a larger cost due to an exponential impact from the future inflation. For the long-term projection, the economic costs saving from with program is more obvious than the short term (Appendix C.6). This is because the exposure reduced in high-risk areas will decrease the total involuntary displacement costs and the implicit total saving increases over time.
4.3 Economic Capital Requirements
To determine the economic capital needed with a high-level degree of certainty, a worst-case scenario estimation has been conducted. This scenario takes into consideration a 20% reduction in GDP for all years, a 10% decrease on the reduction of involuntary costs with program and a very high emission scenario assumed. From Appendix C.7, it can be seen that for both long term and short term, the costs are still within 10% of GDP. The economic costs needed for the short term is around 2.9 billion and for the long term is around 729 billion.
5.Assumptions
5.1 Key Assumptions
- Fatalities and injuries have a monetary value of Ꝕ4 760 884 and Ꝕ203 910 respectively. Studies have found an estimate for societal values in preventing death and the value of a year of life. As of 2022, the value of statistical life is AUS$5.3m and the value of statistical life year is AUS$227,000 (Department of the Prime Minister and Cabinet, 2022). The currency values are then converted with the provided, and publicly available exchange rate information from date 3rd March 2023. This therefore allows the combination and comparison between deadly and damaging natural disasters.
- The severity of natural disasters follows clusters based on their total severity value, where this includes fatalities, injuries, and property damage. Natural disaster can be universally classified based on their total key statistics such as fatalities or economic damage (Caldera & Wirasinghe, 2021). Following from the previous assumption, fatalities and injuries are included with property damage to calculate total severity value. This leads to distributing the natural disasters data and allowing for severity classifications to be determined by the data clustering, of which determines the proportioning of minor, medium and major events.
- 1% of populations in region will relocate under the program. In comparison with multiple other relocation programs, it was examined that a small number of households undertake the program (Bower & Weerasinghe, 2021). Thus, 1% is chosen to be in-line with the contemporary results. Additionally, greater premium pricing in risky areas and the populations’ understanding of the climate risk impacts causes voluntary relocation to be a viable option over not moving. This allows for the forecasting of costs under the relocation program and overall level of cost reduction.
- The voluntary relocation leads to a 20% reduction in involuntary movement costs. When relocating people in risky areas to lower risk areas, there is an expected decrease in the number of people affected by natural disasters overall. With consideration of all natural disasters, relocation will thus play a large role in a community’s long-term recovery (Bodine, Tracy & Javernick-Will 2022), and thus the 20% reduction is chosen to reflect this.
5.2 Additional Assumptions
- Only data from the past 50 years was considered as relevant.
- The distribution of natural disaster severity closely fits a GLM with family Gamma.
- The provided future projection was assumed to cover all possible scenarios, with the very high emissions being the worst possible scenario for natural disasters.
- Additional costs of natural disasters (i.e. material, labour, housing, relocation, household goods replacement) are at the maximum possible level and are constant.
- Relocation costs are only applicable towards owner-occupied houses and population.
- Houses are uninhabitable after a percentage of damage, and thus a larger number of houses are affected per natural disaster than just the property damage against house prices.
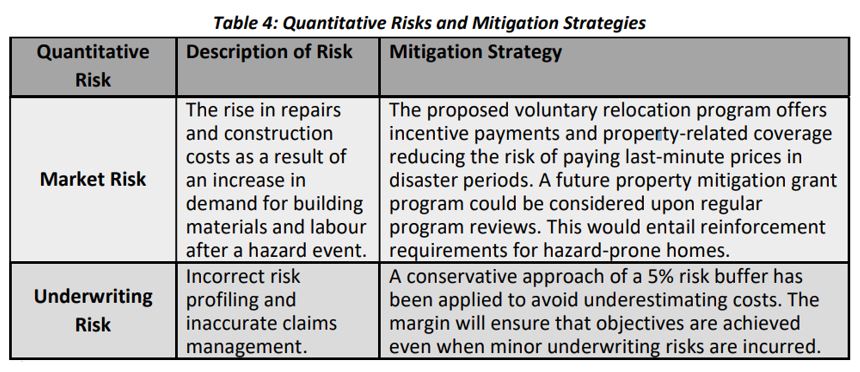
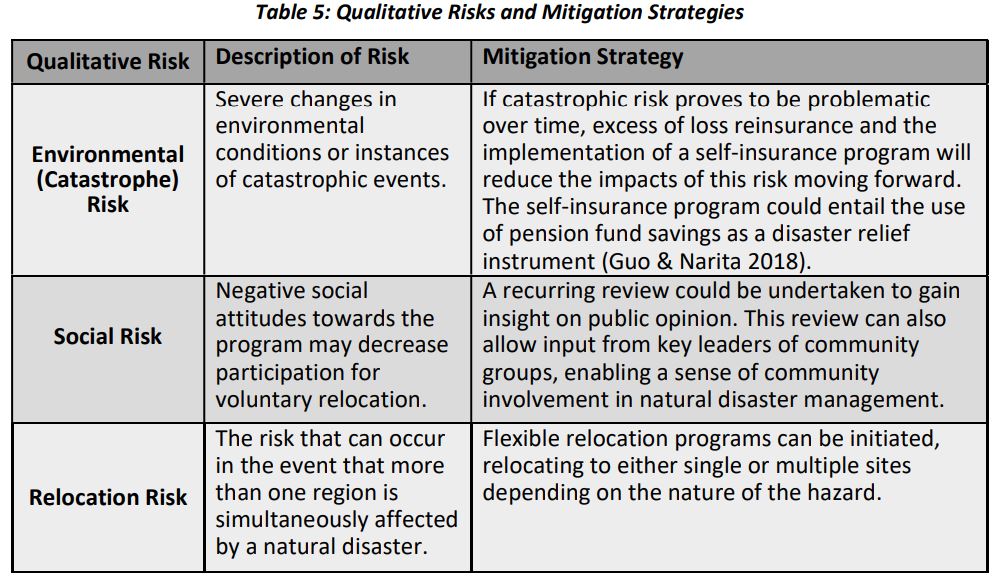
6.Risk and Risk Mitigation Strategies
6.1 Quantitative and Qualitative Program Risks
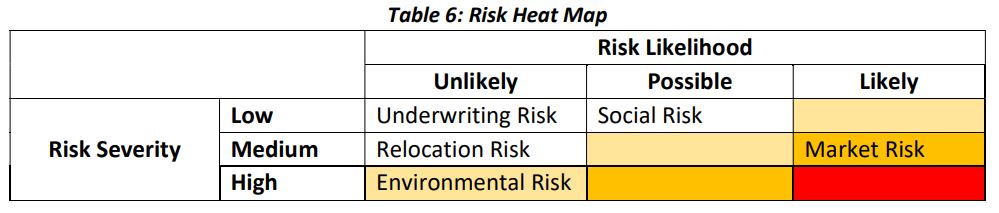
6.2 Likelihood and Severity Heat Map
6.3 Sensitivity Analysis
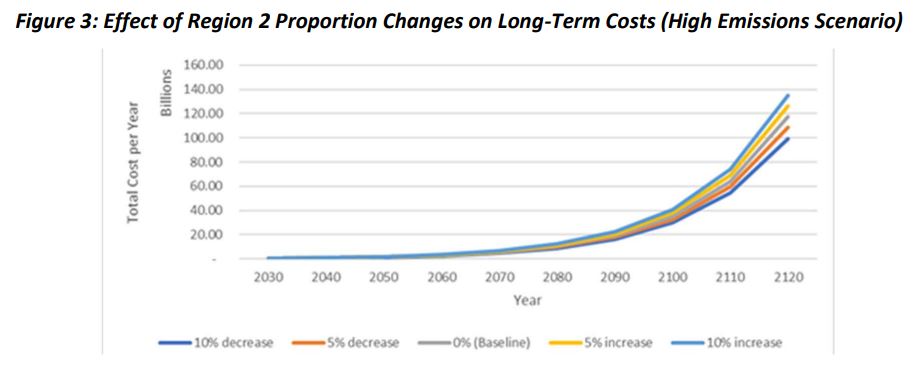
As the program’s main focus is to relocate people to safer regions, the main highlight of the sensitivity analysis was on the total cost proportion of each contributing region to understand sensitivities to relocation changes.
The model demonstrates that region 2 is at the most risk of accumulating the highest costs. Assuming that the proportion of cost changes from region 2 evenly affects the other regions, the total costs of the program increase at a rising rate if region 2 is victim to a larger proportion of costs. Thus, reallocating the original proportion of region 2 costs (23.38%) costs to other regions would alleviate total costs, being the most favourable outcome.
6.4 Without and Without Program Cost Comparison
Regarding the sensitivity implications with and without the program, the program will decrease economic costs in the short term if the number of households voluntarily relocating is controlled. Within the short-term, the program will be break-even with involuntary costs if there is a 12% increase in the incentive payment value or number of expected households participating. Thus, the program may suffer from large surges in voluntary relocation in the short term. However, in the long run, these households would reap the benefits of voluntary relocation, which would see lower chances of incurring involuntary costs evident in Appendix D.1. Thus, the program would incur less economic costs than without the program in the long run with a high level of certainty.
6.5 Program Costs in Comparison to GDP
Worst-case scenario projections and sensitivity testing results clearly show that program costs will not exceed 10% of GDP with a high level of certainty. Short-term and long-term projections remain below the GDP constraint for all four emission scenarios. An extreme stress test has been conducted such that the base model maximises total costs. This scenario is displayed in Appendix D.2 and reveals that the total cost of the program would still not breach the 10% GDP threshold. It can be concluded that the GDP threshold would only potentially be breached in the unlikely event that the cost benefits of voluntary relocation begin to diminish at a rapid rate or if the program is revised such that excessive government expenditure on incentives exceeds the GDP constraint.
7.Data and Data Limitations
7.1 Data Sources
The three data sources, all provided from the Society of Actuaries and where future emissions data originated from IPCC’s SSP Scenarios for Future Atmospheric CO2 Concentrations, Worldwide Population, and GDP, were:
-
Historic hazard event data: Historic hazard event data was used to develop thresholds for hazards to be classified as minor, medium, or major for purpose in the emissions model. This was done using a traditional observation method, as well as K-means clustering and a GLM model. The inflation metrics were used to realise the value of past disaster costs for a more accurate interpretation of them.
-
Demographic data: Demographic data was used for preliminary analysis of Storslysia’s demographic in conjunction with hazard data. Figures such as the “GDP” and “Temporary Housing cost with disaster (per person per month) were used more in program development and projections of the insurance costs and outcomes.
-
Emissions data: The number of minor, medium, and major hazard events found using the historic hazard event data was implemented in the model of emissions data to develop a conservative future world scenario to be used in hazard projection for the purpose of voluntary and involuntary insurance programs for Storslysia. Additionally, the growth rate of world GDP per capita was used as a proxy for the growth rate of Storslysia’s GDP. Limited external data was used, such as an estimate of the value of a statistical life year (in AUD). This was used to more completely model the total cost of disasters and to create a more conservative scenario that still meets the program objectives. Additionally, the US exchange rate data was used to convert this value of a statistical life from AUD to USD, and then from USD to Storslysia’s local currency.
7.2 Data Limitations
There was a small amount of missing data those of which were filled in with standard imputation methods. Additionally, limited demographic data was available, usually only 2-3 years making it difficult to explore long term trends. Lastly, future emissions data was given on a decadal basis, meaning that figures for the years in between that could not be derived in some other way had to be estimated using a simple linear average assumption between decades. The conclusions and projections discussed in this report are deemed to be accurate and reasonable however are dependent on the accuracy and sensibility of the data provided. The data provided, for example, cannot provide a range of exact future world scenarios with probabilities, and hence our results may then be considered as best estimates of future outcomes.
![]()